Degradation Based on Years
Asset Degradation — Degradation by Years
Degradation by Years lets you define exactly how the asset's capacity, power, and efficiency declines on a year-by-year basis — exactly as a manufacturer warranty sheet specifies it.
Input Data
Your table needs one row per operational year (starting at year 0) with these five columns:
| Column | What it represents |
|---|---|
| Operational Year | 0, 1, 2 … n — year 0 is the as-new state |
| Effective Full Cycles (Cumulative) | Total equivalent full cycles accumulated up to that year |
| Asset Capacity Over Years (MWh) | Usable energy capacity at that year |
| Asset Power Rating Over Years (MW) | Rated power at that year |
| Round Trip Efficiency (%) | AC-AC round trip efficiency at that year |
The downloaded sample template pre-fills asset capacity, power rating, and round trip efficiency with the starting values from your technical form.
All rows must be filled — interpolate or extrapolate from your warranty data if a year is missing.
Effective Full Cycles must be monotonically increasing (each year ≥ the previous year).
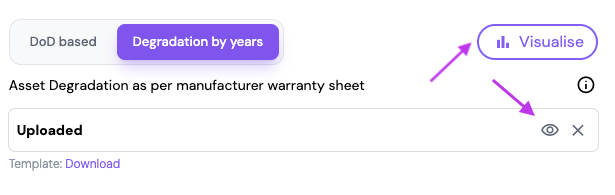
Once filled, click the Eye icon on the upload field to validate your data before proceeding. After upload, click Visualise to view the full degradation profile as a chart.
Worked Example
The table below is from a manufacturer warranty sheet for a LFP BESS, rated at 21.05 MWh / 10 MW initially, with 700 nominal equivalent full cycles per year:
| Year | EFC Total | Asset Capacity Over Years (MWh) | Asset Power Rating Over Years (MW) | Round Trip Efficiency (%) |
|---|---|---|---|---|
| 0 | 0 | 21.05 | 10.00 | 90.25 |
| 1 | 700 | 20.32 | 9.95 | 89.80 |
| 2 | 1400 | 19.55 | 9.88 | 89.32 |
| 3 | 2100 | 18.79 | 9.80 | 88.79 |
| 4 | 2800 | 18.12 | 9.71 | 88.21 |
| 5 | 3500 | 17.51 | 9.63 | 87.68 |
| 6 | 4200 | 16.92 | 9.55 | 87.10 |
| 7 | 4900 | 16.37 | 9.46 | 86.55 |
| 8 | 5600 | 15.85 | 9.38 | 85.97 |
| 9 | 6300 | 15.35 | 9.29 | 85.42 |
| 10 | 7000 | 14.86 | 9.20 | 84.80 |
How the Platform Uses This Data
Cycles Per Day
The platform derives the average daily cycle rate from the incremental change in cumulative EFC across all years:
Using the example above — each year adds exactly 700 EFC (700 − 0, 1400 − 700, … ) across all 10 years:
This derived value overrides the max cycles per day entered in the technical form — the uploaded file is treated as the source of truth.
SoH at End of Life
State of Health at end of life is calculated from the final year's capacity relative to year 0:
Using the example:
This value is automatically populated in the SoH field — no manual entry needed.
Visualising the Profile
Click Visualise to open the Degradation Over Time chart — a stepped graph plotted across calendar years for the full project lifetime.
- Left Y-axis — Energy capacity (MWh)
- Right Y-axis — Power rating (MW)
- X-axis — Calendar year from project start to end
Both Energy and Power are plotted as step lines, each holding flat within a year and dropping at the year boundary.
DoD Based vs. Degradation by Years
| DoD Based | Degradation by Years | |
|---|---|---|
| Best for | Cycle-count warranty curves | Year-by-year capacity warranty sheets |
| Degradation model | Capacity fade vs. DoD cycles | Step function across operational years |
| Cycles/day | Entered manually | Derived from cumulative EFC column |
| SoH at EoL | Derived from cycle limits | Derived from final vs. initial capacity |