Storage Dispatch Modeling
The storage dispatch model optimizes battery operations under market and asset constraints. It determines how battery systems operate to maximize revenue while adhering to technical and market limitations. This capability is central to our investment analysis and trading simulations.
Battery Energy Storage Systems (BESS) are unique in their ability to act as both electricity consumers and producers, dynamically adjusting operations in response to market signals. Our storage dispatch model aligns with the power market schedule, treating the battery as a digital twin of a real trading asset. This is not a theoretical optimization in isolation but a practical representation of how a BESS participates, wins, or loses bids in each market.
Key Inputs to the Dispatch Model
The dispatch model integrates several critical input categories:
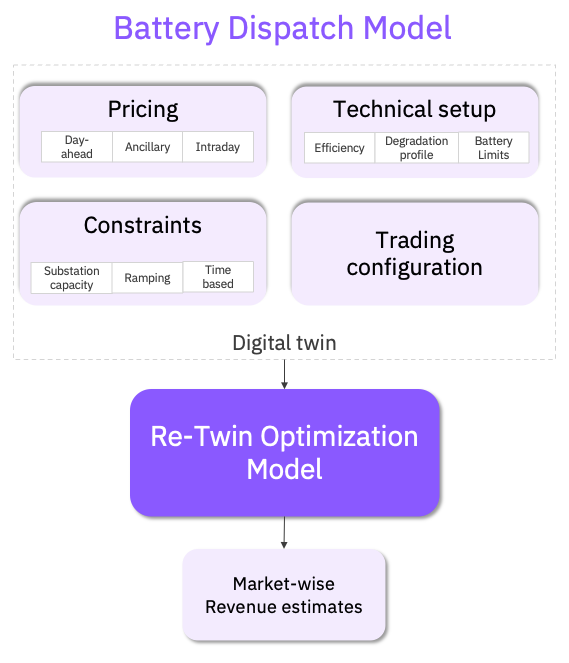
- Pricing: Day-ahead, intraday, and ancillary market price forecasts form the economic foundation of trading decisions.
- Technical Setup: Efficiency losses, degradation considerations, and state-of-charge (SoC) limits ensure realistic dispatch outcomes.
- Constraints: Substation capacities, ramping requirements, and time-based operational restrictions are explicitly modeled.
- Trading Configuration: Bid structures and participation rules define how the BESS competes in each market.
These inputs feed into the Re-Twin Optimization Model, which simulates sequential bidding decisions. The model mirrors real-world trading by submitting bids into each market, with some winning, others being rejected, and subsequent rounds adapting to prior results. This approach captures the inherent uncertainty and dynamics of market-based storage revenues.
Revenue Estimation
The model estimates revenue from three primary sources, simulating how a BESS monetizes its capabilities across different markets.
1. Revenue from Ancillary Services (Capacity)
This income is earned by committing capacity to the grid operator, regardless of whether it is dispatched. It is a stable revenue stream based on the battery’s power rating and substation capacity. For each service (e.g., FCR, aFRR, mFRR), the revenue is calculated as:
Revenue = Power Committed (MW) * Capacity Price (€/MW)
The model assumes no energy is dispatched (lost or gained) when calculating this baseline capacity revenue.
2. Revenue/Cost from Wholesale Markets (Arbitrage)
This represents the core profit from buying low and selling high in the spot markets. The model optimizes bidding in both the Day-Ahead (DA) and Intraday Continuous (IDC) markets. For each time interval, the net revenue is:
Net Revenue = (Energy Sold * Market Price) - (Energy Bought * Market Price)
This captures the fundamental value of energy arbitrage.
3. Revenue/Cost from Ancillary Services (Energy)
This is the income earned or cost incurred when reserved ancillary capacity is activated to deliver or absorb energy. The model pursues these opportunities based on the results from the day-ahead market.
- Positive Activation (e.g., aFRR positive): Energy delivered to the grid generates revenue.
- Negative Activation (e.g., aFRR negative): Energy absorbed from the grid is typically a revenue stream (being paid to take energy) but is treated as a negative cost.
To account for the higher uncertainty in aFRR energy dispatch compared to the day-ahead market, the model applies a strategic bidding approach:
- Positive (aFRR_POS) Energy Bids: Priced at a premium: 50% above day-ahead prices.
- Negative (aFRR_NEG) Energy Bids: Priced at a discount: 50% below day-ahead prices.
With these price levels established, the model then determines the optimal volume to bid based on potential revenues and the battery's state of charge. This sequential process allows the model to pursue additional opportunities in intraday, aFRR energy, and imbalance markets after day-ahead positions are secured.
4. Intraday Temporal Arbitrage
The continuous, pay-as-bid nature of the intraday market creates opportunities for temporal arbitrage. This is a purely financial strategy where a trader leverages short-term price volatility by executing multiple buy and sell orders for the same delivery period. The objective is to secure a profit from price differentials while ensuring a net-zero physical position by the time of delivery.
Consider the following illustrative trade sequence for a 1 MWh delivery block between 11:00 and 12:00:
- 07:15: A contract is executed to buy 1 MWh at €40/MWh.
- 09:15: A subsequent contract is executed to sell 0.7 MWh at €50/MWh.
- 10:34: A final contract is executed to sell the remaining 0.3 MWh at €70/MWh.
The financial outcome of this sequence is a profit of €16, calculated as (€50 * 0.7) + (€70 * 0.3) - (€40 * 1). The trader's physical position for the delivery hour is zero, isolating the activity to a financial gain derived solely from market price movements.
Re-Twin's Intraday Temporal Arbitrage Estimation
Re-Twin employs a quantitative model to estimate the potential financial value of intraday temporal arbitrage. The methodology is grounded in the analysis of historical price volatility and incorporates conservative assumptions to produce a realistic valuation.
- Data Source: The model utilizes historical Volume-Weighted Average Price (VWAP) data at a 5-minute resolution.
- Volatility Analysis: For each hourly delivery product, we analyze the 8-hour period immediately preceding delivery. Within this window, we identify the maximum and minimum 5-minute VWAP.
- Gross Spread Calculation: The potential arbitrage spread is defined as the difference between the observed maximum and minimum VWAP within the analysis window.
- Conservative Adjustments: To reflect real-world trading limitations and risk, we apply two key derating factors:
- Capture Rate: We assume that only 10% of the gross VWAP spread can be practically captured due to market friction, timing, and transaction costs.
- Traded Volume: We model a traded volume equivalent to 10% of the asset's rated capacity (in MWh), representing a prudent risk management approach.
Valuation Formula
The estimated arbitrage value for a given hour is derived from the following formula:
Arbitrage Value (€) = (Asset Capacity [MWh] * 10%) * (Max VWAP - Min VWAP [€/MWh]) * 10%
Where:
- Max VWAP: The maximum 5-minute VWAP observed in the 8-hour window prior to delivery.
- Min VWAP: The minimum 5-minute VWAP observed in the 8-hour window prior to delivery.
Why Structure by Market Schedule?
Our dispatch framework offers an investor-grade methodology for evaluating BESS revenues under real market rules. Unlike perfect hindsight models, our approach incorporates conservative assumptions and reflects the operational challenges of bidding. The model can be customized with scenario-specific parameters based on user inputs, such as:
- Alternative bidding strategies
- Adjusted SoC or efficiency assumptions
- Region-specific constraints and rules
Ultimately, the dispatch model bridges the gap between forecasted market opportunities and practical asset operations, providing a realistic view of how a BESS generates revenue across Europe’s power markets.